

x

Office Hour Mon - Fri 9.00 am - 7.00 pm


Artificial Intelligence (AI) has anonymously attracted people around the world regardless of any business sector especially technology companies such as Google, Facebook, Amazon, Microsoft or Apple. These companies are continuously interested in using this artificial intelligence in sales and marketing strategies.
Undoubtedly, Artificial Intelligence (AI) and marketing is very important for all types of businesses nowadays. As, AI has developed in order to facilitate in term of recognition (such as voice, face or objects), complex problems solving, translation or planning. By using AI, marketers would be able to analyse business more precisely as the target audience is based on marketing information obtained from AI. In some of AI, the feature called machine learning (ML) is added, allowing AI to create certain systems to process and solve the problem by itself.
Machine learning or machines that can process and solve sets of problems by itself by using Algorithm. The Algorithm is a set of commands that designed to process like human but considerably faster. For instance, when marketers want to analyse enormous amounts of data, it may take a great deal of time to gather, study and analys. However, AI will play the role of a virtual assistant in the processing such enormous amounts of data in order to facilitate the marketers to clearly see the target audience. AI also allows the marketing team to plan campaigns or promote quickly and directly to the target group.
It is undeniable that large set of data is the main problem in analysing the data. When having large number of variables, it is impossible to choose only one variable to analyse as every variable make an impact on marketing strategy.
Taking the statistics of the online advertising via Facebook as an example.The data are given daily and are classified and analysed by its objective without bias. The statistic includes the value of Impression, Reach, Click, Link Click, Engagement, Video View, New Message etc. These values are influenced by the variables of gender, age, province, impression, ad delivery times, etc. All of these variables are equally important.
Which the Principal Component Analysis or PCA that we commonly use for decomposition the data in the preparation process and clean the data to reduce features redundancy and minimise the feature space, cut out the unimportant variables without losing any important information.
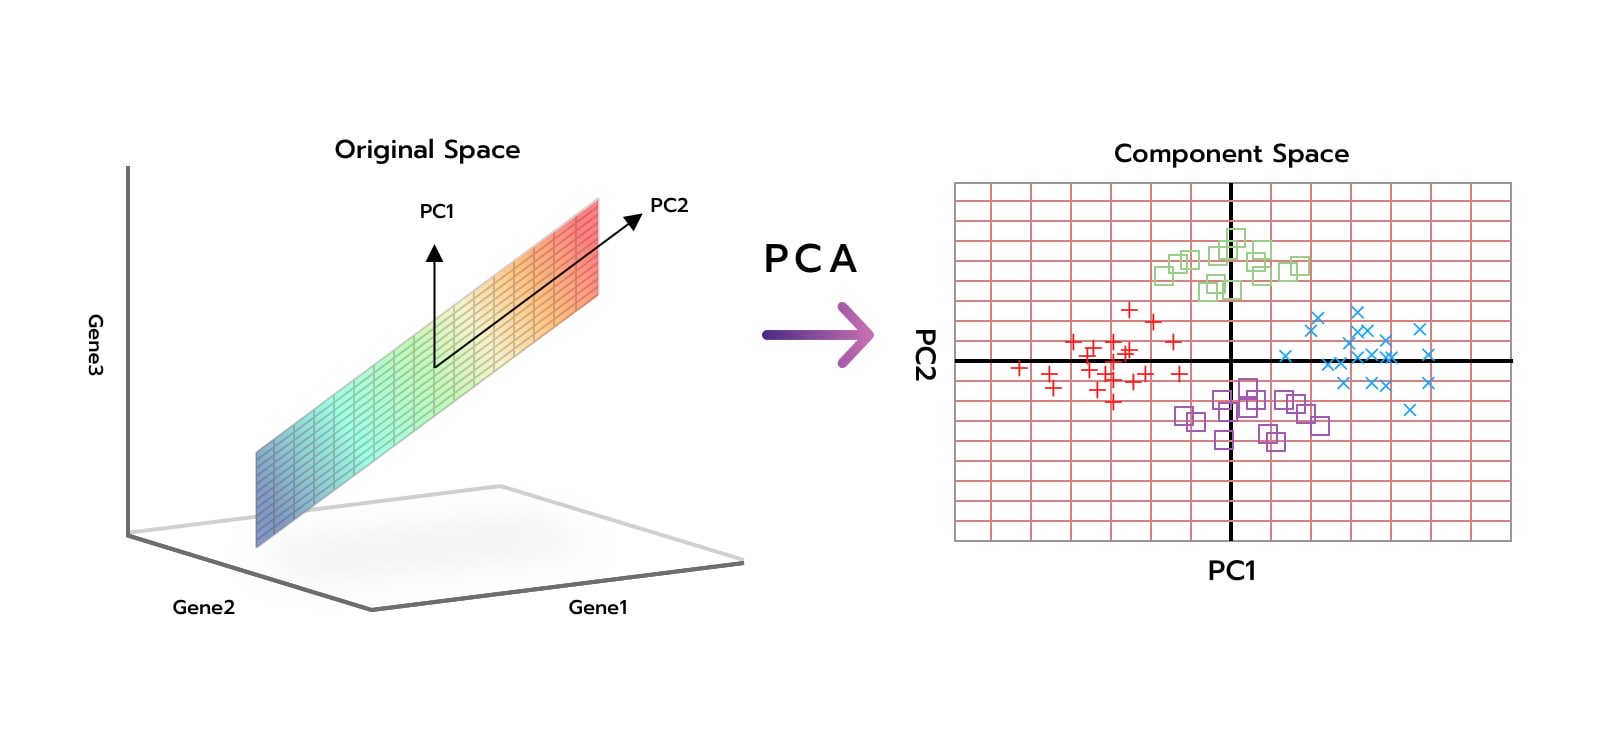
Many Media Buyers have faced the same problem in allocating ad groups that are relevant to the target group. This may include how many ad groups that are appropriate for each campaign. However, this can be solved with the use of the Principal Component Analysis (PCA) model to help clustering data.
The result after using the PCA model to manage the ad set on Facebook, it is found that the relevant data sets are clustered closely together and irrelevant data sets will be scattered around. This assists us to classify the ads according to the Clustering that sets the data to be used in target audience identification.
So, PCA do not only assist us in allocating ad groups, reducing the cost of advertising costs in each ad set but also increase the efficiency of our advertisement.

In the present, large set of data is the main problem in analysing the data. Besides, it is also important to choose the right data set model for your business. Each model has different limitations and conditions. If we use unsuitable models for the data set, the accuracy in data analysis will be reduced and the results will also be distorted.
It is undeniable that every business has a formula or model that is used to forecast sales. Whether by using Moving Average, Linear Regression, and Normal Exponential Smoothing. However, all of these three will be forecast by focusing on the smoothing of the data set but do not capture Seasonal.
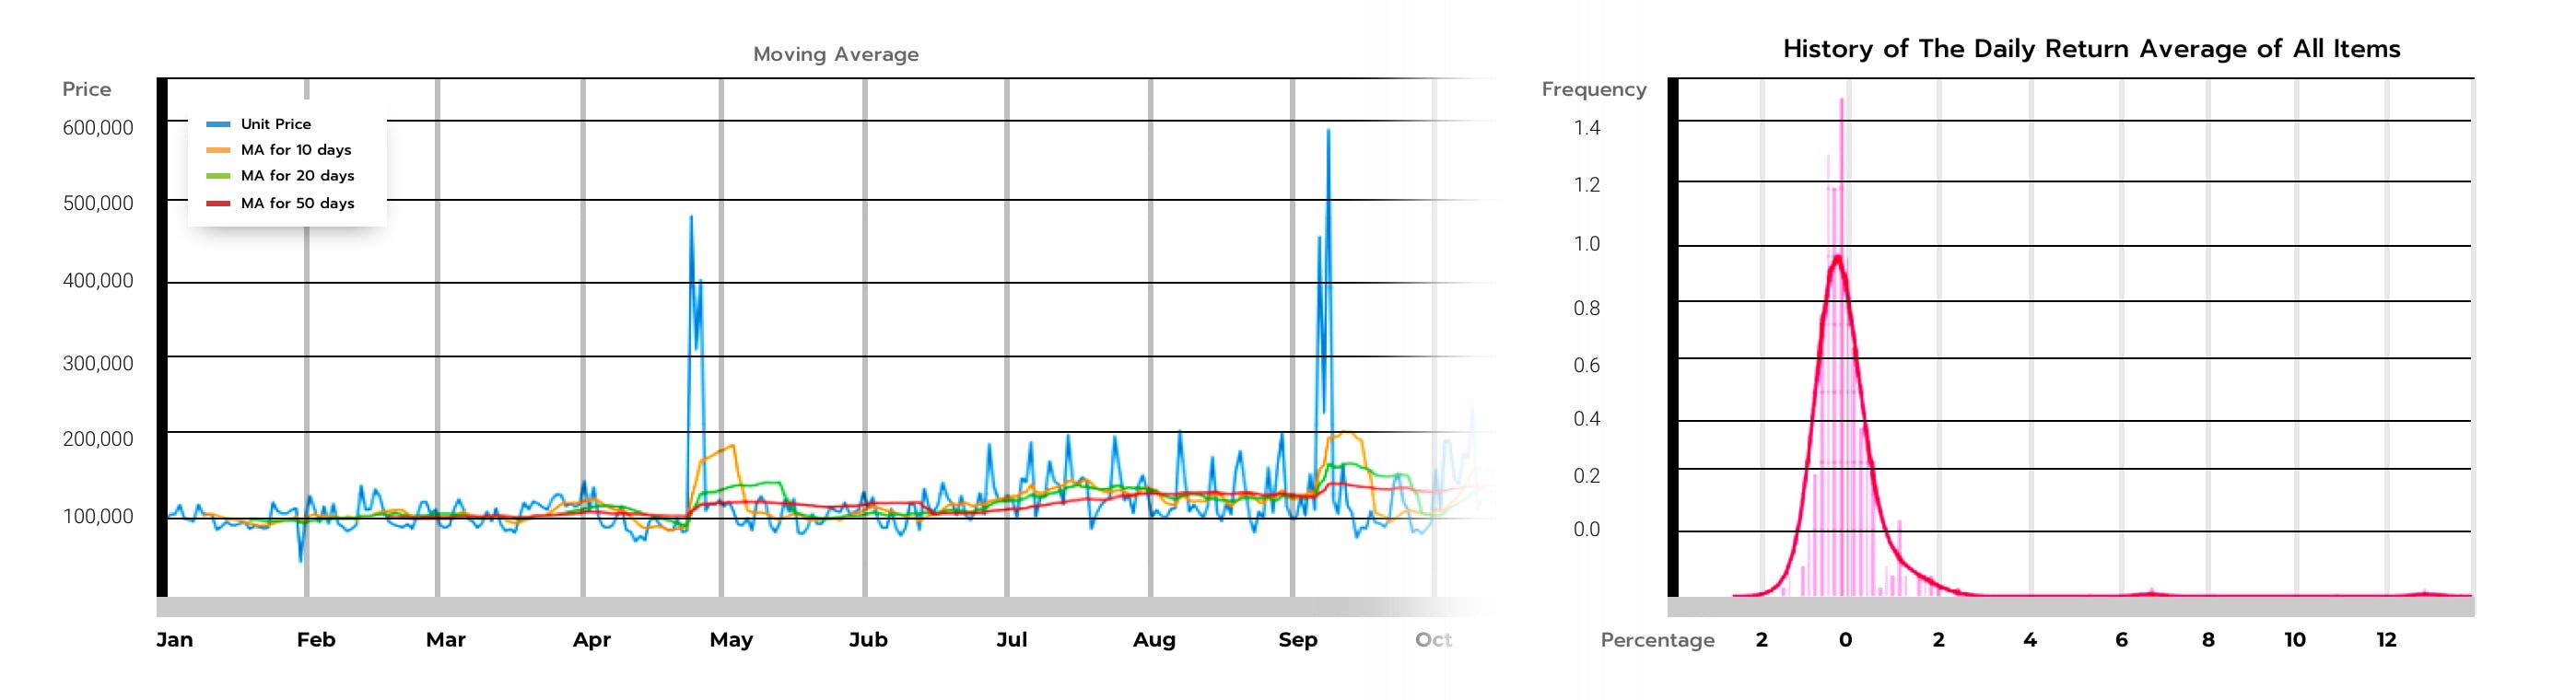
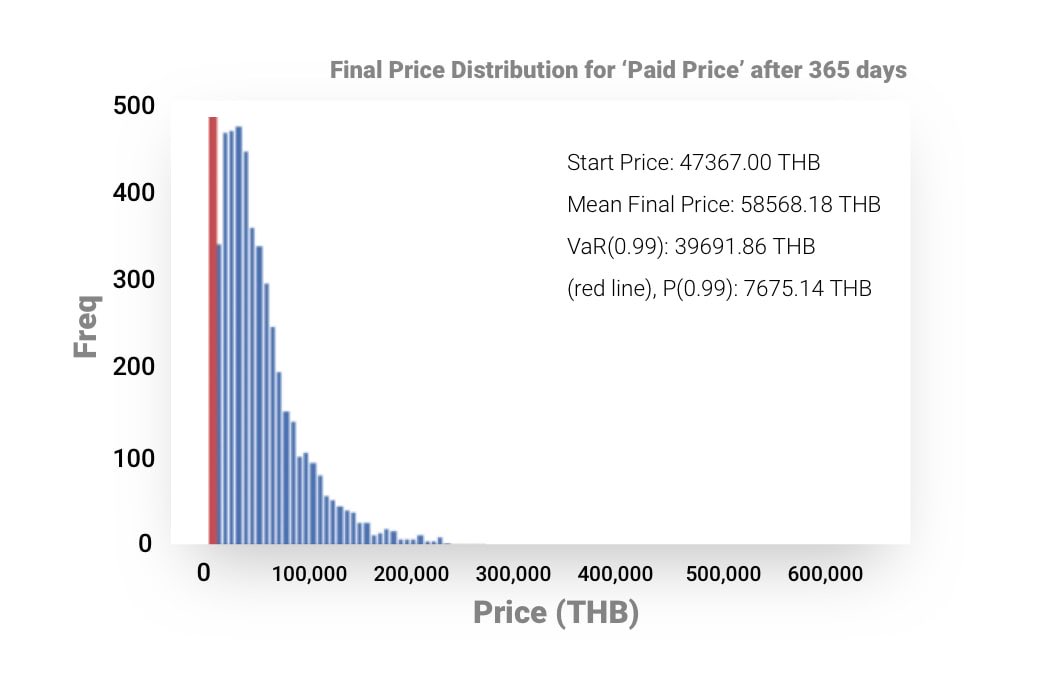
Monte Carlo is a model that is repeatedly sampled the data we have to create the simulated data set. This can be achieved by using statistical analysis methods such as regression analysis. The analysis of the simulated data is beneficial as it can be used to predict the probability or the possibility of this data set in the future.
The most common problem that many marketer have faced is using the unsuitable sales forecasting model.
After using Monte Carlo model to manage data set on POS (Point of Sale), CRM system or order data set, it is found that Monte Carlo indicates the risk of Seasonal, shut down point of business and the average sales volume that should be in each QOQ, YOY, which will result in forecasting market data to be more accurate.
Monte Carlo does not only allow business to forecast sales, it is also able to define marketing strategies for each upcoming season of the business. Moreover, it allows us to prepare if our sales fell to the point of Shut Down.
Nowadays, large amount of data and the lack of data management are the main problem in data analysis.
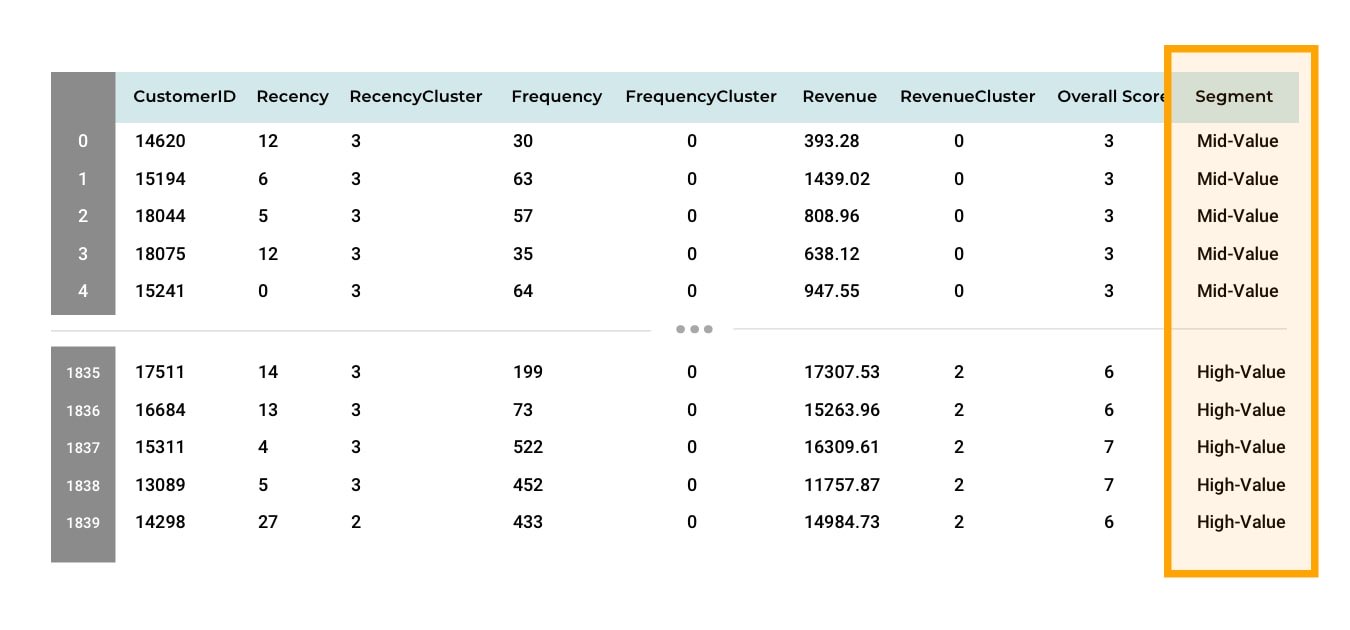
In this section, we will give examples of data on POS (Point of Sale) systems, CRM systems or order data sets by calculating Customer Lifetime Value and Segment Tier of our customers.
Recency, Frequency, and Monetary (RFM) is a segmentation method that is commonly used to facilitate us to easily understand customer behaviour. This method focuses on the duration of the last service (R), the number of times or the frequency (F) and sales (M), respectively. All 3 values will be calculated to help divide customers into categories to identify customers who are likely to respond to promotions and personal services in the future (Personalise).

K-Mean is Clustering, which uses statistical basis which requires more than 2 variables. K-Mean Data Segmentation is used for dividing the number of observations from N viable to K group. Each observation group will be in the group with the closest mean (used as a template).
The result from K-Mean enables us to assume that the points that are close to each other are the same segment, the distant point should be separated by segment. When comparing K-Mean with RFM, it assists us to analyse the segmentation of the target group more precisely.

NIPA is the leader in digital transformation and the expert in Digital Marketing of all channels. The results of each marketing campaigns will be analysed by the our Marketing Specialist team together with the Data Science team to satisfy all of our customer's requirements and drive sustainability in customer's business.

